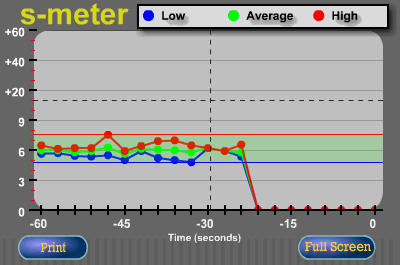
The CommCat Live S-meter shows the last minute of readings from your radio's s-meter. Three lines are shown on the graph: red for peak value; green for average value; and blue for low value. The highest and lowest s-meter reading for the past minute are shown by the green band.

Each dot represents one sample taken over approximately 3 seconds. The exact timing will vary depending on Internet delays.
The CommCat Live s-meter provides a number of useful benefits. It is an easy way to spot changing band conditions, to compare signals, or for a person you are working to compare their own power output settings, antennas, or beam headings.
If a visitor wants to have a printed copy of the s-meter graph, they can click PRINT. A visitor can also display the s-meter graph expanded to fill their screen by clicking Full Screen. The s-meter graph is not updated while in the full screen mode. Press Esc or click Full Screen to return to the normal view.
Click Low, Average, or High in the graph key to turn off and on the respective line on the graph.